Data Pane (Virtual Cube Editor)
Use the data pane to display the virtual cube's data. The default view in the data viewing pane shows the data in table format with one dimension across the column headings and another dimension down the left column. (Measures are treated as a single dimension for this purpose.) The remaining dimensions of the virtual cube are displayed in the data slicing pane.
The white cells in the data viewing pane represent the measure values according to the members that appear in the members boxes for all the dimensions shown in the data slicing pane. In the preceding example, the measure values reflect the
Working in the Data Viewing Pane
To browse the cube data in the data viewing pane by any combination of dimensions, drag measures or dimensions from the data slicing pane onto either axis in the data viewing pane.
To replace a dimension in the data viewing pane with another dimension
- Drag the dimension from the data slicing pane to the dimension in the data viewing pane that you want to replace.
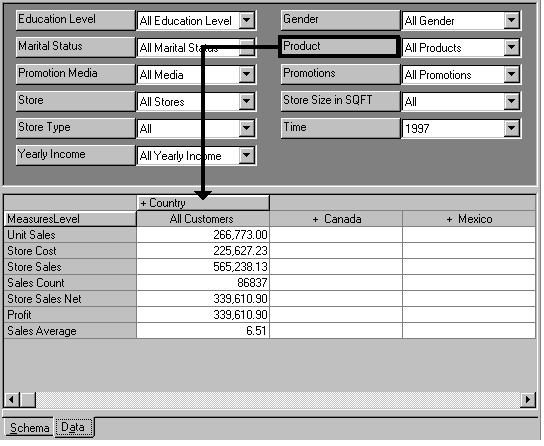
The pointer is in the correct position when it appears like this.

-or-

The dimension in the data viewing pane moves up to the data slicing pane and the new one takes its place.
To move a dimension to the data viewing pane
- Drag the dimension from the data slicing pane to a cell below (or beside) the existing dimension.
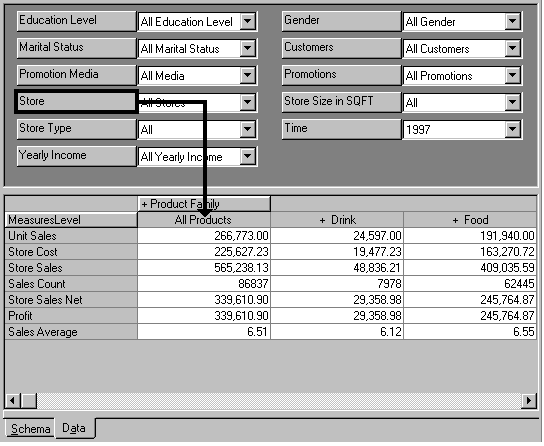
The pointer is in the correct position when it appears like this.

-or-

The new dimension appears under (or beside) the existing dimension, expanding your data viewing pane.
To change the order of dimensions in the data viewing pane
- Drag the dimension and drop it on the dimension where you want it to be located.
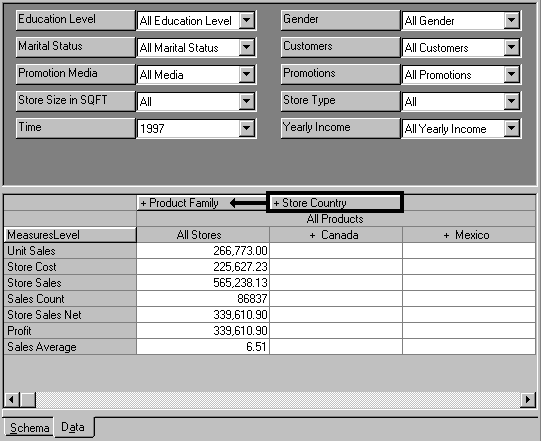
To remove a dimension from the data viewing pane
- Drag the dimension you want to remove from the data viewing pane to the data slicing pane.
To drill down into a member
- Double-click a dimension member in the data viewing pane. If the member has members beneath it, they are displayed.
Only the member you double-click is expanded. The other members retain their current levels in the data viewing pane. In the following example, double-click the Drink member to drill down into its child members.
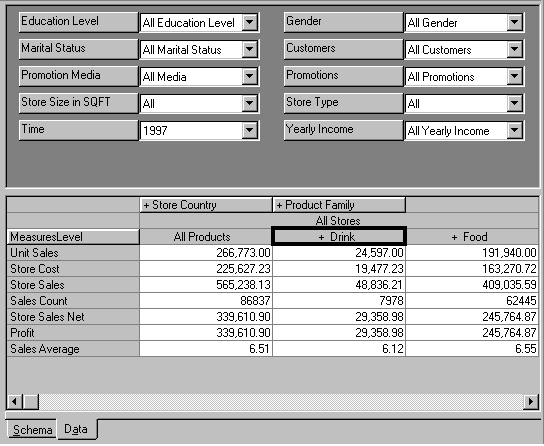
If you want to display all the members in a level, double-click the parent level name in the data viewing pane. Level names are depicted with the shading of a button (for example, Product Family in the preceding example).
To slice through a dimension
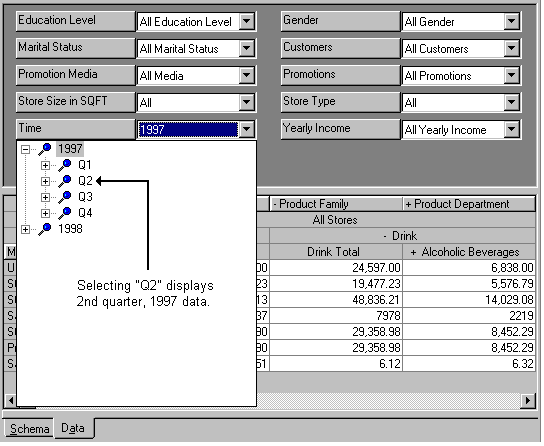
- To change the member in a dimension in the data slicing pane, click the down arrow on the members box, expand the members, and then select a new member. The cube data in the data viewing pane changes to reflect the change in the dimension member.
The Data tab has an internal memory limit that you may reach if you attempt to browse too much data or drill down too deeply. When you reach the limit, the following message is displayed:
Unable to display current view of cube.

Unable to Allocate Memory For Flexgrid.
You cannot increase the limit by adding or allocating more memory. If you reach the limit, reduce the amount or depth of data you are attempting to browse or use another browser.